A Look At The World’s Most Extreme Weather (Infographic)
2013 has seen some particularly unusual weather in locations all over the world, but how does this year compare with the last century? In this infographic we’ll take a look at the world’s most extreme weather, from the highest and lowest temperatures to the most rainfall and much, much more.
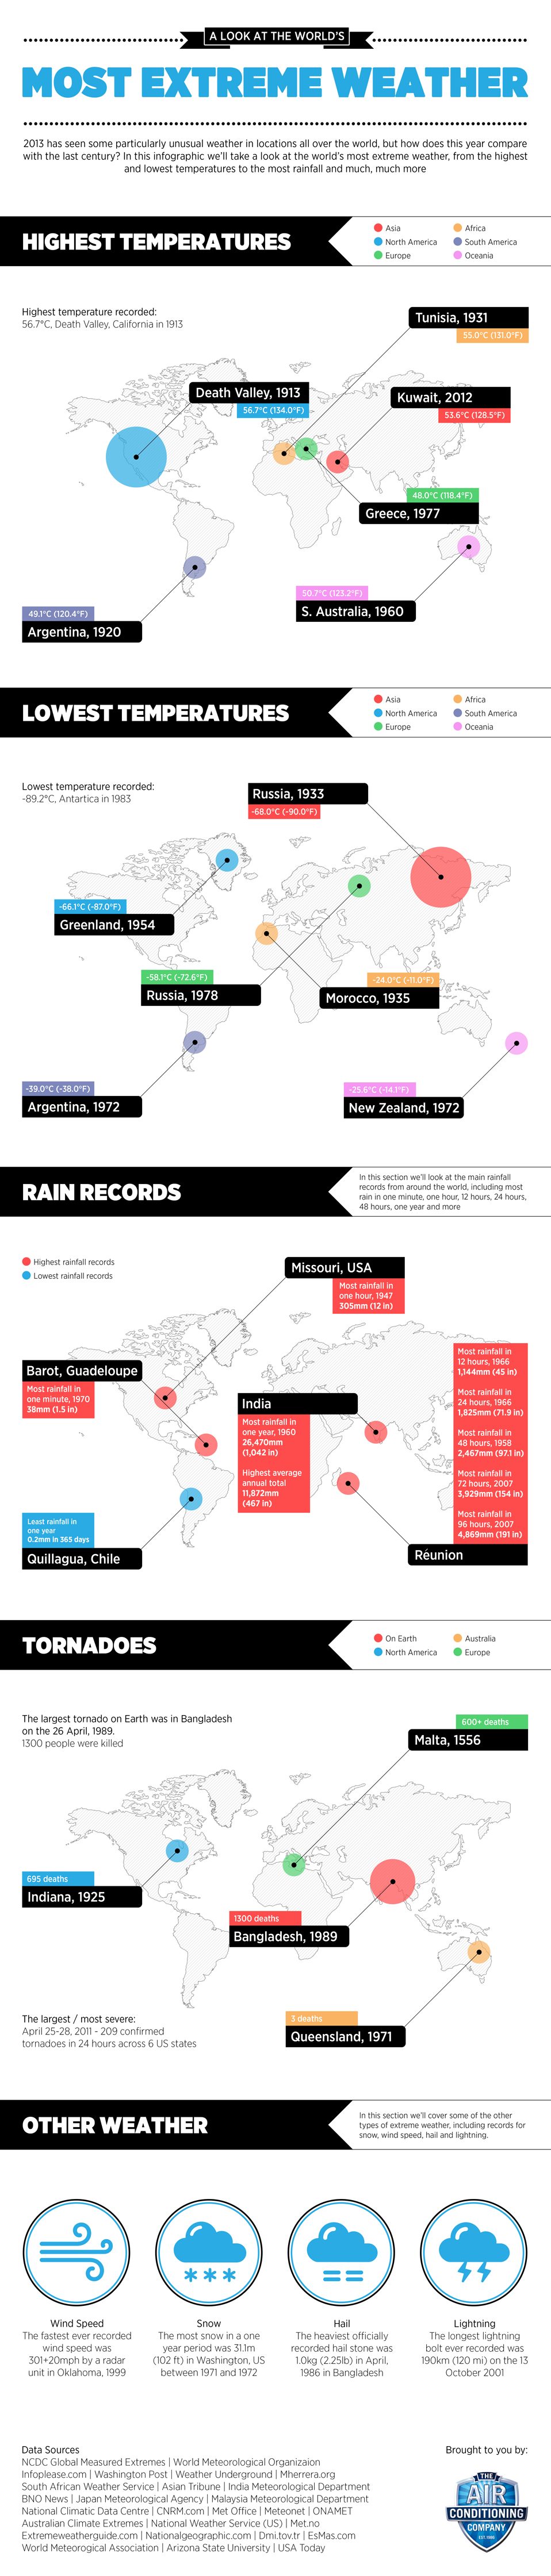
Source: Airconco

")


 Infographic")


")


![9 Surprising Stats About Entrepreneurs That Will Inspire You [INFOGRAPHIC]](https://i2.wp.com/www.ucollectinfographics.info/wp-content/uploads/2025/10/interesting-stats-about-entrepreneurs_524c41624cd8f-670x1924.jpg?w=100&resize=100,80&ssl=1 "9 Surprising Stats About Entrepreneurs That Will Inspire You [INFOGRAPHIC]")


![Dog Bite Statistics [INFOGRAPHIC]](https://www.ucollectinfographics.info/wp-content/uploads/2025/03/dog-bite-infographic-100x80.png "Dog Bite Statistics [INFOGRAPHIC]")


