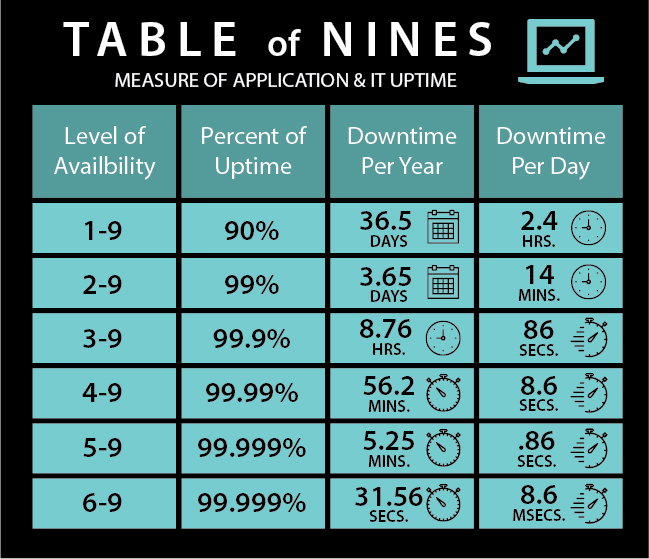
Table of Nines for Application Uptime and Availability
The latest advance in technology have resulted in a major dependence on applications to successfully operate.
More organizations are striving to implement metrics on the performance of these applications and frequently incorporating these into the overall KPI’s of their business.
Certain industries, such as Legal and Finance, require high levels of availability to perform their required tasks.
As such, unplanned or planned IT maintenance and incidents need to be closely watched and monitored. This infographic illustrates the availability of users to access a service or access a service or system while noting the corresponding downtime, or when these systems are unavailable or down, from an end-users perspective.
![]()

")


 Infographic")


")


![9 Surprising Stats About Entrepreneurs That Will Inspire You [INFOGRAPHIC]](https://i2.wp.com/www.ucollectinfographics.info/wp-content/uploads/2025/10/interesting-stats-about-entrepreneurs_524c41624cd8f-670x1924.jpg?w=100&resize=100,80&ssl=1 "9 Surprising Stats About Entrepreneurs That Will Inspire You [INFOGRAPHIC]")


![Dog Bite Statistics [INFOGRAPHIC]](https://www.ucollectinfographics.info/wp-content/uploads/2025/03/dog-bite-infographic-100x80.png "Dog Bite Statistics [INFOGRAPHIC]")


